patternCustom
Plot radiation pattern using spherical coordinate system (phi and theta angles)
Syntax
patternCustom(magE,theta,phi)
patternCustom(magE,theta,phi,Name,Value)
hplot = patternCustom(___)
Description
patternCustom(magE,theta,phi) plots the 3-D radiation pattern of an antenna magnitude, magE over the specified phi and theta angle vectors.
hplot = patternCustom(___) returns handles of the lines or surface in the figure window. This syntax accepts any combination of arguments from the previous syntaxes
Examples
Visualize Radiation Pattern From Antenna Data File
Consider a helix antenna data file in .csv format. This file contains the magnitude of the antenna directivity in phi and theta angles. Read The File
Command : openExample('antenna/VisualizeRadiationPatternFromAntennaDataFileExample')
helixdata = csvread('antennadata_test.csv',1,0);
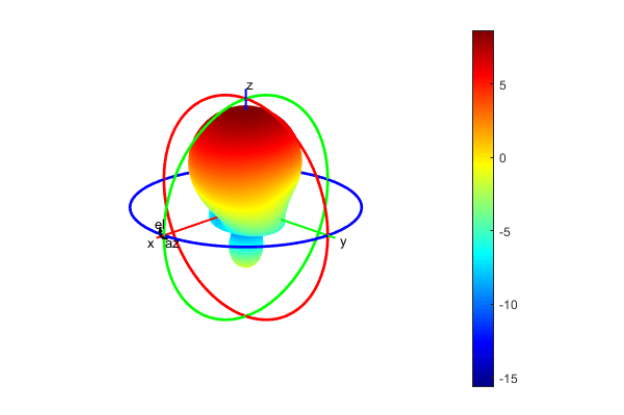
Use patternCustom to extract the magnitude of directivity, and the phi, and theta angle values. Plot the 3-D polar radiation pattern.
patternCustom(helixdata(:,3),helixdata(:,2),helixdata(:,1));
 |
Visualize Radiation Pattern From Antenna Data File |
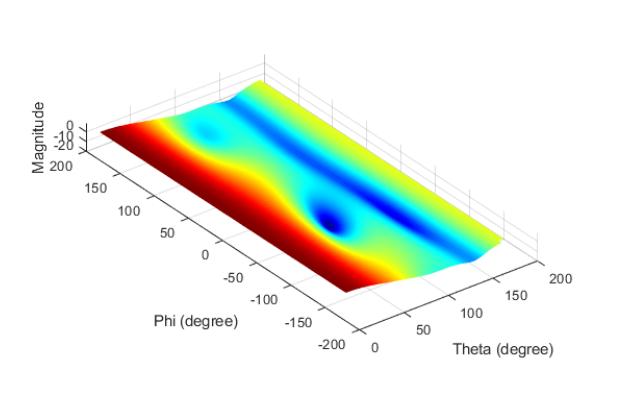
Use the same data to plot the 3-D rectangular radiation pattern.
figure
patternCustom(helixdata(:,3),helixdata(:,2),helixdata(:,1),...
'CoordinateSystem','rectangular');
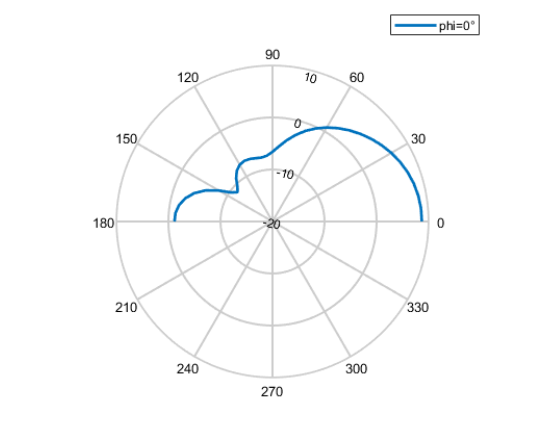
Plot 2-D phi slice of the antenna in polar coordinates.
figure;
patternCustom(MagE, theta, phi,'CoordinateSystem','polar',...
'Slice','phi','SliceValue',0);
 |
| Plot 2-D phi slice of the antenna in polar coordinates. |


No comments:
Post a Comment