The Smith Chart tool is a graphical calculator designed specifically for analyzing impedance and reflection coefficient in RF (Radio Frequency) circuits. It's a powerful visualization tool that helps engineers understand the relationship between these two crucial parameters.
Here's a breakdown of the Smith Chart tool:
- Function: Visually represent impedance values and analyze how they impact signal transmission in RF circuits.
- Appearance: A circular chart with two overlapping scales: resistance (horizontal) and reactance (vertical).
- Applications: Primarily used for impedance matching, where the goal is to achieve optimal power transfer between a source and a load in an RF circuit.
- Benefits: Offers a clear visual representation of complex calculations, aiding in analysis, design, and troubleshooting of RF circuits.
- Examples of Use:
- Finding the conjugate match (ideal impedance for perfect matching)
- Determining the reflection coefficient based on the impedance value
- Analyzing the impact of component changes on overall impedance
- Visualizing resonant frequencies and reactance values in RF circuits
While the Smith Chart might seem complex at first, it's a valuable tool for anyone working with RF circuits. Imagine it as a map that helps you navigate the often-tricky world of impedance and signal transmission.
In the realm of radio frequency (RF) engineering, visualizing and analyzing the intricate relationship between impedance and reflection coefficient is paramount. Enter the Smith chart, a powerful graphical tool that has become an indispensable asset for RF professionals. This comprehensive guide delves into the world of the Smith chart tool, exploring its history, principles, applications, and practical usage, equipping you to navigate the electromagnetic maze with newfound confidence.
The Birth of a Legend: The History of the Smith Chart
The Smith chart owes its creation to Phillip Hagar Smith, a brilliant engineer at Bell Telephone Laboratories. In 1939, Smith devised this ingenious graphical representation to simplify the complex calculations involved in impedance matching, a crucial aspect of RF circuit design. (keyword: Smith chart history)
Demystifying the Smith Chart: A Visual Representation of Impedance
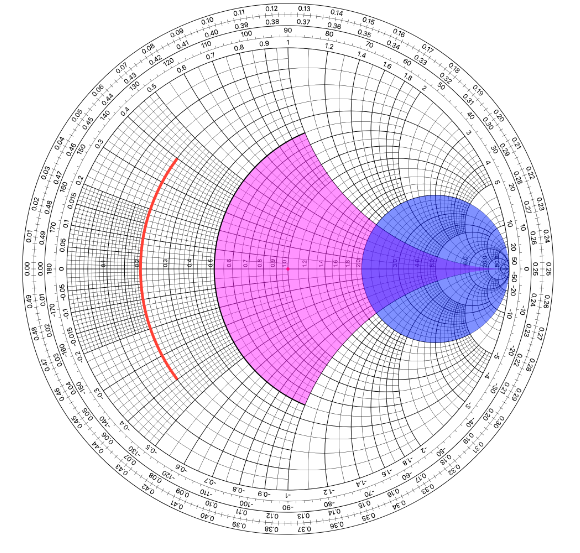
The Smith chart appears as a circular diagram with two overlapping scales:
- Resistance (R) Scale: The horizontal axis represents the resistance component of an impedance (measured in ohms).
- Reactance (X) Scale: The vertical axis represents the reactive component of an impedance (measured in ohms), which can be inductive (positive) or capacitive (negative).
Impedance values are plotted on the Smith chart as a single point. The location of this point depends on both the resistance and reactance values of the impedance. (keyword: Smith chart components)
Understanding the Magic Behind the Chart: Key Concepts
Several key concepts underpin the functionality of the Smith chart:
- Constant Impedance Circles: Circles centered on the periphery of the chart represent constant resistance values. Moving inwards along a constant resistance circle signifies decreasing reactance.
- Constant Reactance Circles: Circles centered on the chart with a zero resistance value represent constant reactance values. Moving outwards along a constant reactance circle signifies increasing resistance (for inductive reactance) or decreasing resistance (for capacitive reactance).
- Smith Chart Coefficients: The chart incorporates markings for reflection coefficient (Γ), a crucial parameter in analyzing how much of a transmitted signal is reflected back due to impedance mismatch. (keyword: Smith chart concepts)
The Power of Visualization: Applications of the Smith Chart Tool
The Smith chart empowers RF professionals with a multitude of applications:
- Impedance Matching: The primary application of the Smith chart involves visualizing and achieving optimal impedance matching between a source and a load in an RF circuit. A perfectly matched impedance results in maximum power transfer and minimal signal reflection. (keyword: Smith chart impedance matching)
- Smith Chart Calculations: The chart facilitates calculations like finding the conjugate match (the ideal impedance for perfect matching) or determining the reflection coefficient based on the impedance value.
- Smith Chart Analysis: RF engineers use the Smith chart to analyze the behavior of RF circuits, including identifying resonant frequencies, calculating reactance values, and visualizing the impact of component changes on the overall impedance.
- Smith Chart Smith Chart Design: The chart can be used during the design phase of RF circuits to select appropriate components that achieve the desired impedance characteristics.
Utilizing the Smith Chart Tool: A Practical Guide
While the theoretical concepts underpinning the Smith chart might seem intimidating, practical usage becomes more intuitive with experience. Here's a basic guide to using the Smith chart tool:
- Identify Impedance Values: Determine the resistance and reactance values of the impedance you want to analyze.
- Locate the Point on the Chart: Plot the impedance value on the Smith chart by finding the intersection of the constant resistance circle corresponding to the resistance value and the constant reactance circle corresponding to the reactance value.
- Analyze and Interpret: Based on the location of the point on the chart, you can perform various analyses, such as determining the reflection coefficient or visualizing the impact of component changes on the impedance.
Smith Chart Tools in the Digital Age
While traditional paper Smith charts remain valuable, the digital age has brought forth a plethora of Smith chart software tools and online calculators. (keyword: Smith chart software) These tools offer several advantages:
- Interactive Interface: They provide a user-friendly interface where you can input impedance values or manipulate components virtually to observe the real-time effects on the Smith chart.
- Advanced Features: Some software offers advanced features like automatic calculations, annotations, and integration with circuit simulation tools.
- Accessibility: Online Smith chart calculators offer a convenient way to perform quick analyses without requiring dedicated software installation.
The Future of the Smith Chart Tool
Despite the emergence of advanced simulation tools, the Smith chart remains a cornerstone of RF engineering due to its simplicity, visual clarity, and ability to provide a deeper understanding of impedance behavior. As RF technology continues to evolve, the Smith chart is likely to remain a valuable tool for generations of RF
Example Smith Chart Tool ::
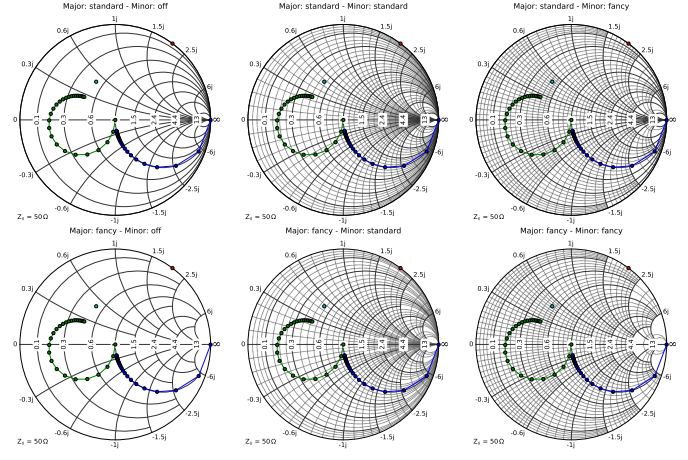

3. Smith Chart


Windows Smith Chart software for RF circuit design. This software allows the user to perform interactive impedance transformation and matching on a Smith Chart. Please visit this blog for more information on the usage of the software.
Written in Visual Basic .NET. To compile:
- Create a new Visual Basic Windows Application project in Visual Studio (Version 2013 onwards).
- Add all the *.vb (visual basic code files) and *.resx (resource files) into the project.
- Build the project.
- Alternatively the pre-compile *.exe file is also included, which you can use immediately, for Windows 7 and above. Just copy to the harddisk and it should be able to run immediately. (source : Github.com)
No comments:
Post a Comment